AgentScript runs in the browser. This means the models you create will be contained within an HTML file.
HTML Files
An HTML file for AgentScript models is very simple:
<html>
    <head>
        <title>Hello</title>
    </head>

    <body>
        <script type="module">
            // Your JavaScript code goes here
        </script>

        <!-- You create an HTML <div> for the model to run in. -->
        <div id="modelDiv"></div>
    </body>
</html>
Your JavaScript code goes in the script area. You also need a simple HTML element, the "div" above, in which we display the running model. We'll build some of these later. (Note the two different comment types: // for JavaScript and <!-- .. --> for HTML)
You can put your Model's code in the script area, especially if it is relatively simple. Or you can create a separate .js file that is your Model, and import it into the HTML file.
Imports have a huge advantage: you can use the same Model in many different HTML files. For example, we have a "Hello World" HelloModel.js that is used in Text, 2D, 2.5D, 3D, GIS, MVC and more!
They all import the HelloModel like this:
import Model from 'https://code.agentscript.org/models/HelloModel.js'
The simplest example of this is the Text example above, who's HTML looks like:
<html>
    <head>
        <title>Hello</title>
    </head>
    <body>
        <script type="module">
            import * as util from 'https://code.agentscript.org/src/utils.js'
            import Model from 'https://code.agentscript.org/models/HelloModel.js'

            util.printToPage('Running for 500 steps.')

            const model = new Model()
            await model.startup()
            model.setup()

            util.repeat(500, model.step)

            const sample = util.sampleModel(model)
            util.printToPage(sample)
        </script>
    </body>
</html>
The HelloModel is imported into the script area, with the rest of the script running the model 500 steps and printing a sample of the model's data when done.
Browser's Developer Console
As mentioned in the JavaScript tutorial, browsers all support a Developer Console which lets you step through your model to see the state of the model at a given place in your code. It also provides a handy console.log() function to print values within JavaScript code to the Developer Console.
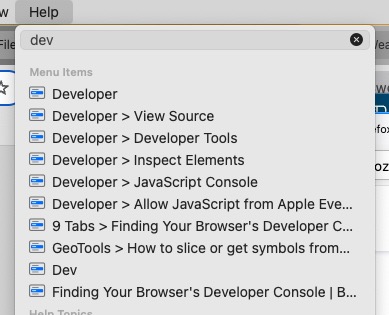
Here's an article on finding your browser's Developer's Console. Or you can use your browser's help menu (type "dev" should do it).
Also there are keyboard shortcuts: Chrome "Option" + "Command" + "J". Safari uses "Option" + "Command" + "C". Edge uses "Control" + "Shift" + i.
To get started, go to our pheromone.html page. Then open the Developer Console as above.
Chrome's looks like this:
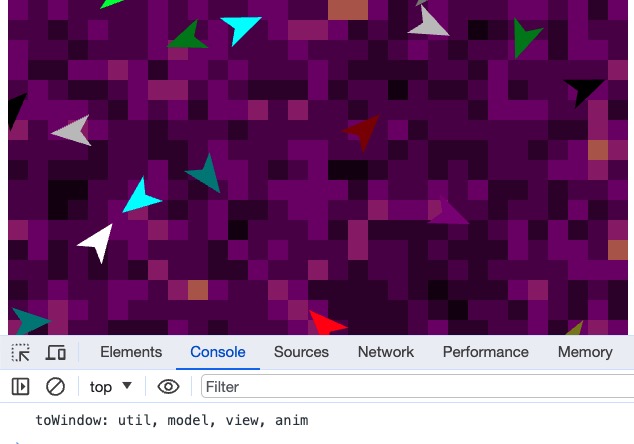
In the row of choices, click on "Console" if not already highlighted. You'll get the view shown above. The text "toWindow ..." is used by the model to make these variables available for debugging. Type "model" at the prompt to see the model's state.
Browser's view-source Capability
In addition to the browser's Developer Console, the Browser has a very handy way to look at a page's HTML.
Like opening the Developer's Console with "Option" + "Control" + "J" in Chrome, using "Option" + "Control" + "U" will open a new tab showing the current page's HTML. You can also right-click any blank part of the page, and select View Page Source from the pop-up menu.
The view-source details are discussed here: in case your browser uses a different scheme.
You can see this in action with our pheromone.html above, and see the code via "Option" + "Control" + "U" or equivalent. You'll see:
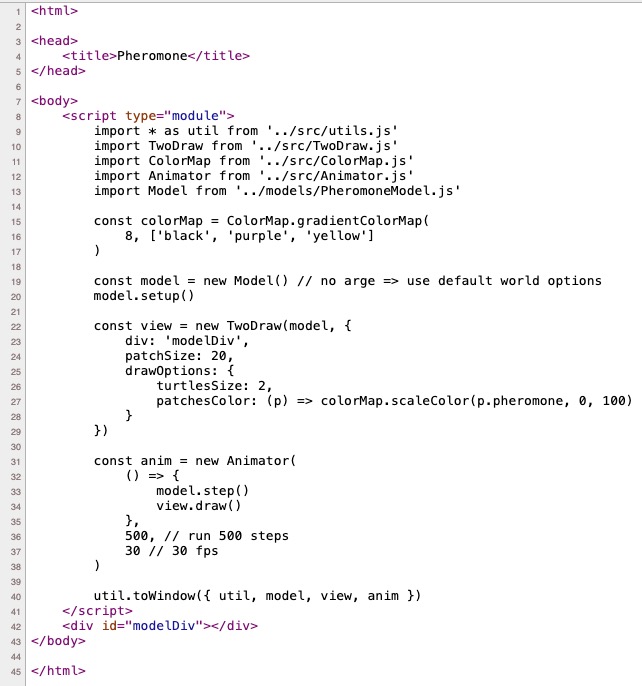
Just FYI: The Model used is our PheromoneModel, the parts of which come from our Snippets demo. The pheromone.html imports the Model, sets up the View, and runs the model and view in our Animator .. a complete MVC example!